Data is currently at
https://data.giss.nasa.gov/gistemp/tabledata_v4/GLB.Ts+dSST.csv
or
https://data.giss.nasa.gov/gistemp/tabledata_v4/GLB.Ts+dSST.txt
(or such updated location for this Gistemp v4 LOTI data)
January 2024 might show as 124 in hundredths of a degree C, this is +1.24C above the 1951-1980 base period. If it shows as 1.22 then it is in degrees i.e. 1.22C. Same logic/interpretation as this will be applied.
If the version or base period changes then I will consult with traders over what is best way for any such change to have least effect on betting positions or consider N/A if it is unclear what the sensible least effect resolution should be.
Numbers expected to be displayed to hundredth of a degree. The extra digit used here is to ensure understanding that +1.20C resolves to an exceed 1.195C option.
Resolves per first update seen by me or posted as long, as there is no reason to think data shown is in error. If there is reason to think there may be an error then resolution will be delayed at least 24 hours. Minor later update should not cause a need to re-resolve.
For reference, in the latest dataset gistemp run I have April 2024 as 132.04 (~ same as official 1.32), so the highest bin will ~ correspond to a tie or higher of 2024 (if it does not get adjusted downwards in the future)..
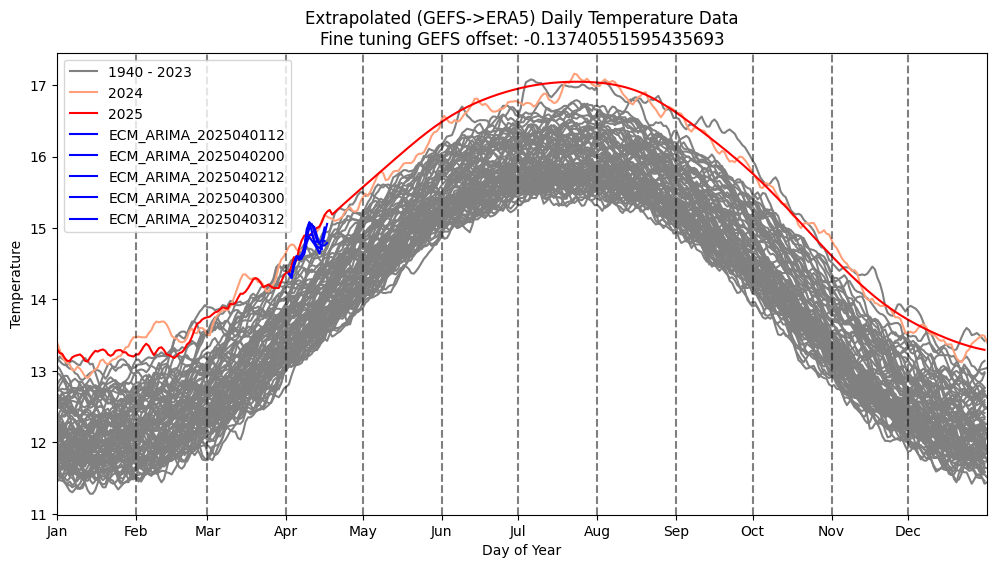
Changed the way prophet extends GEFS for remainder of month (don't try to manually adjust the trend so its smooth from historical to forecast period -- I think anecdotally based on past behavior I've observed it's better to leave it alone than try to make it not have any jumps on the first prophet forecast date).
Reference probabilities I'm loosely using at this point is the grey line: from splitting the ARIMAX adjusted GEFS + prophet and ARIMAX adjusted ECM and re-weighting probabilities by shape of distribution (expected value by offset std dev)

If I have time I'll try some experiments tomorrow to see if I can use the long-range full GEFS perturbation set with all 31 members (rather than just the average) from old wednesday forecast runs to improve upon Prophet (it will be tough to validate though for putting it to use, as it is time consuming and resource consuming to run the tests let alone write them -- each set of 31 members temperature data is ~900+MB for a single mode run, so I don't even have enough disk space to do check more than a few of them). If anyone has attempted this let me know how it worked out.
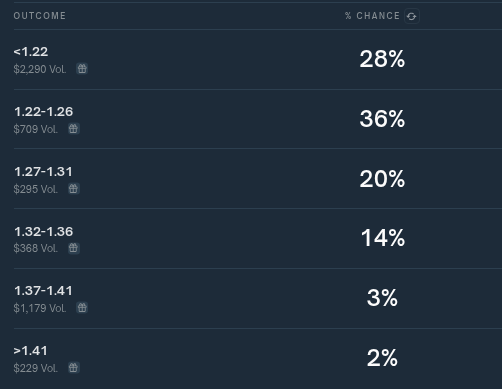
Current Polymarket for April for reference:

They use quite different bins but my point forecast isn't too inconsistent with Polymarket's current estimate.
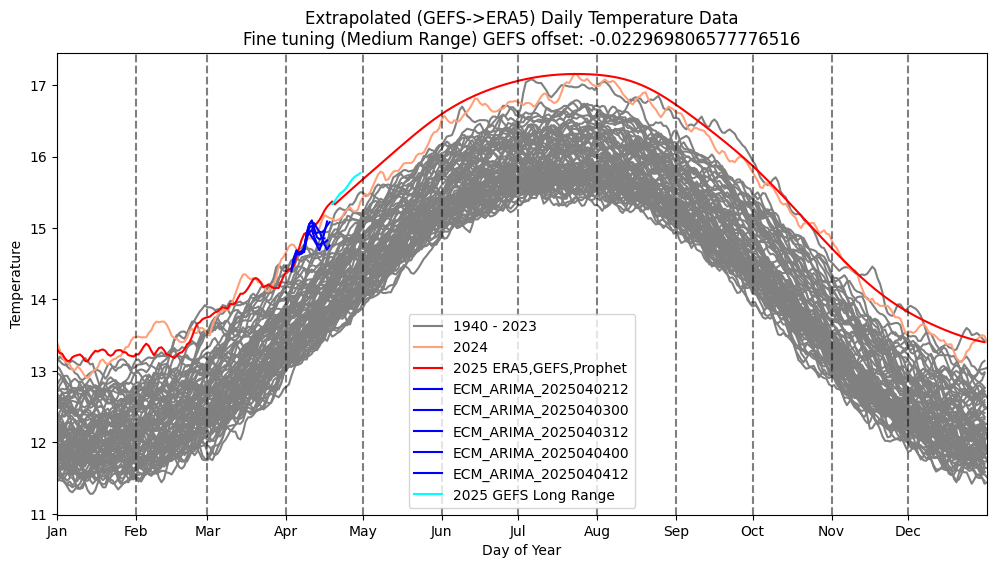
Current fit,arimax adjusted GEFS (+Prophet), ECM split forecast for April (ignore past April)

Later this year ECMWF will be providing open access to its data so we will have access to its long range forecast products (including I believe its long range ensembles), but for now have only statistical extrapolation and other long range models like GEFS to guide us).
I have preliminiarily added long-range GEFS forecasts (not bias adjusted?) to work flow. Are they worse than statistical projections (like from Prophet) for this question? Validation is out of scope and resources for me. I will find out how it does experimentally in April later this month, but for now the GEFS mean is super aggressive for end of month (nearly 0.3 C above ERA5 record for May 1). I do recall this GEFS adjusted version was also super aggressive last month as well relative to ECM despite downward adjustments from ARIMAX.
I am weighting the combined medium range GEFS runs equally with the ECM runs, and trying to also weigh the average temperature is in between the statistical prediciton from prophet and the long range GEFS.

The difference in final temps for a prediction for LOTI from the two methods is 1.267 (Prophet) to 1.321 (Splitting the difference between all the methods).
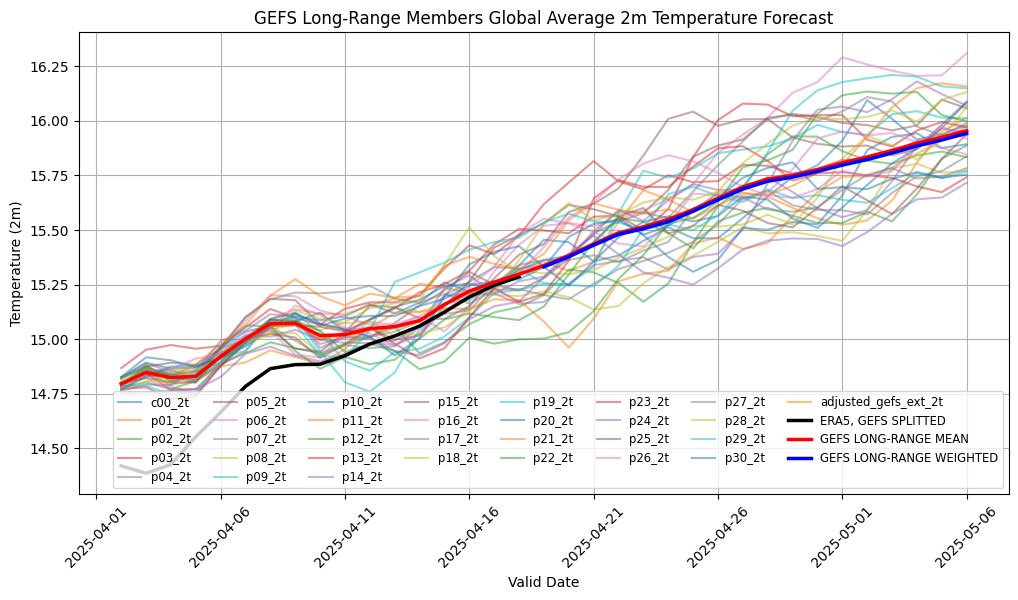
The following is what the long-range Wednesday (init. April 2, 2025) forecast looks like after fitting to ERA5 data with a linear regression (the model isn't significantly different from GEFS-BC) (red is calculated mean):

Most of the black line is actually lower as an adjustment (prediction) by ARIMAX and splitting the average with the ECM data, which is also lower (i.e. the black line is not the GEFS data but derived from it)
For this run, trying to weight by performance of ensemble members with naive methods (by trying to 'recalibrate' it to the newer forecast data by MAE or RMSE) doesn't result in any appreciable difference from the mean. This may change as more ERA5 data comes in to overlap (for now there is only a single point) so most of it is just recalibration a couple days apart.