Data is currently at
https://data.giss.nasa.gov/gistemp/tabledata_v4/GLB.Ts+dSST.csv
or
https://data.giss.nasa.gov/gistemp/tabledata_v4/GLB.Ts+dSST.txt
(or such updated location for this Gistemp v4 LOTI data)
January 2024 might show as 124 in hundredths of a degree C, this is +1.24C above the 1951-1980 base period. If it shows as 1.22 then it is in degrees i.e. 1.22C. Same logic/interpretation as this will be applied.
If the version or base period changes then I will consult with traders over what is best way for any such change to have least effect on betting positions or consider N/A if it is unclear what the sensible least effect resolution should be.
Numbers expected to be displayed to hundredth of a degree. The extra digit used here is to ensure understanding that +1.20C resolves to an exceed 1.195C option.
Resolves per first update seen by me or posted as long, as there is no reason to think data shown is in error. If there is reason to think there may be an error then resolution will be delayed at least 24 hours. Minor later update should not cause a need to re-resolve.
 1,000
1,000 3.00
3.00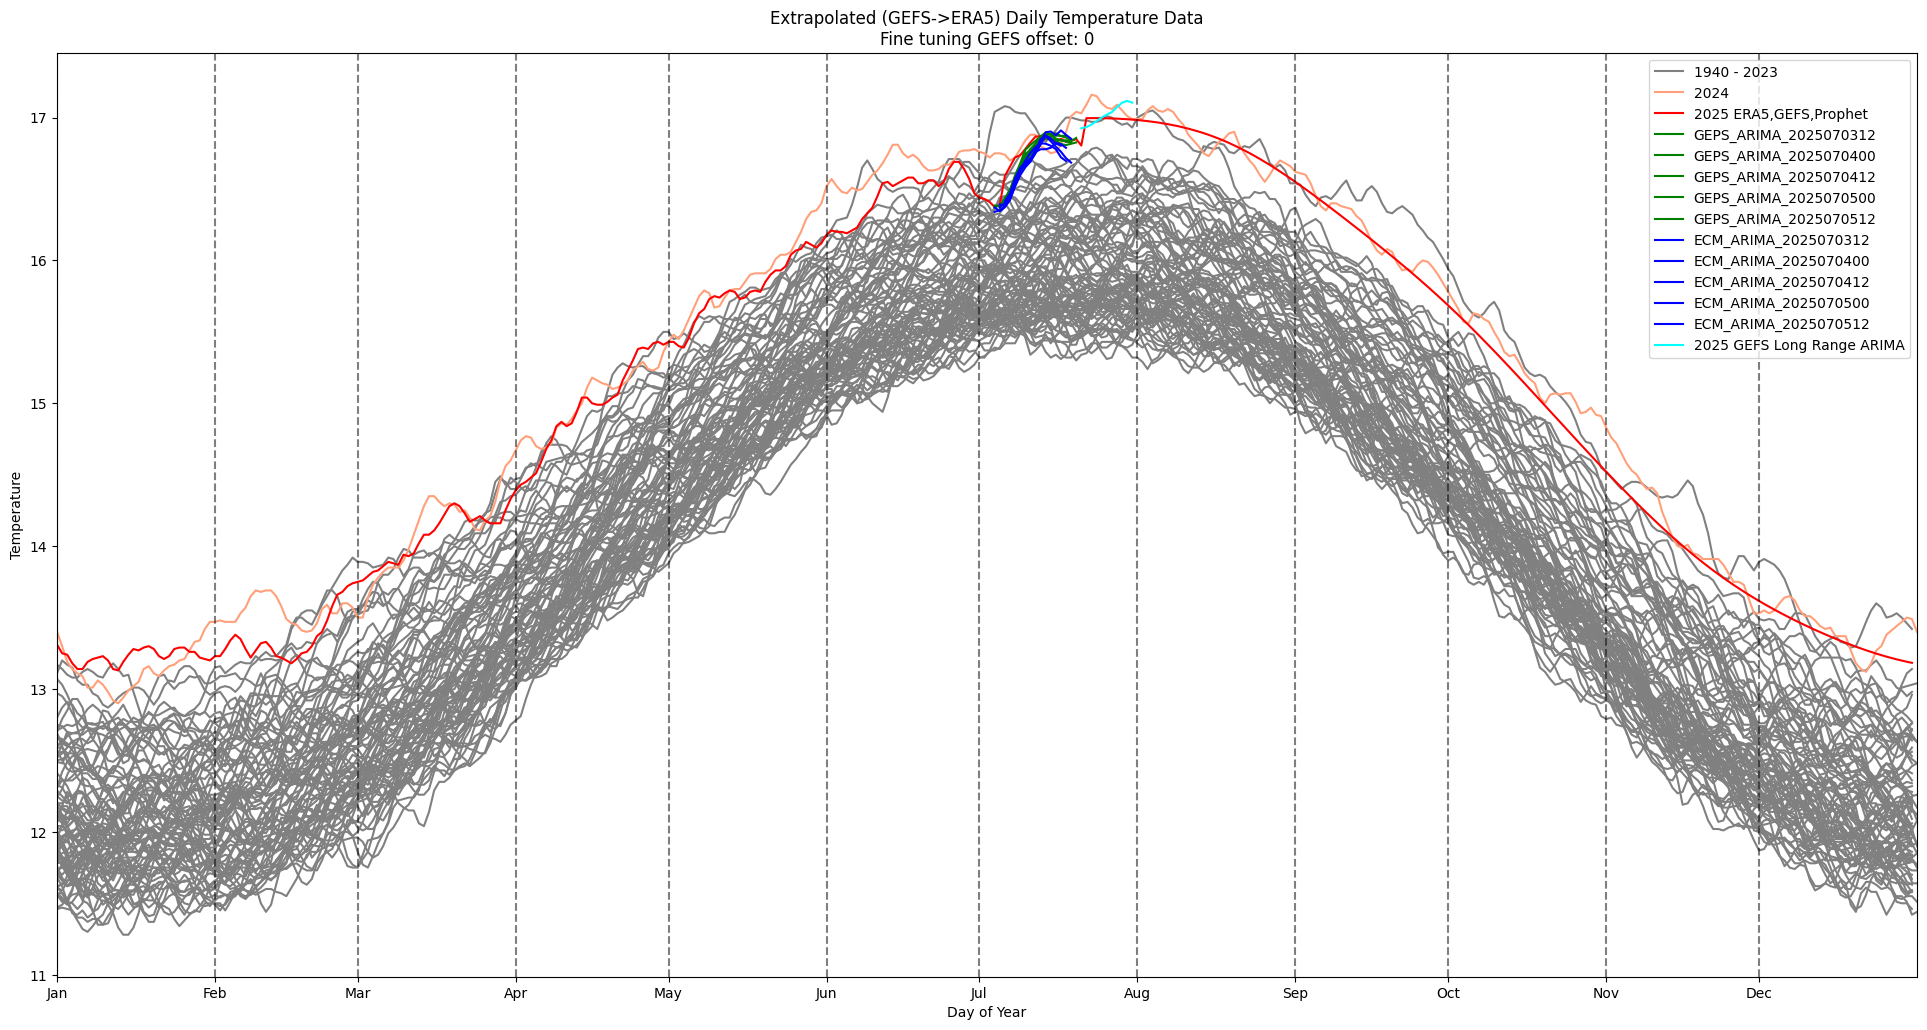
Models now all agree in next 15 days of a major rise... after that who knows (the decline at the end of June/beginning of July was very abnormal to me based on some simple statistical ARIMA models)...
can see how far away from the 95% CI of the model before the drop by all the horizontal blue lines (monthly mean prediction) above the yellow current 95% region:
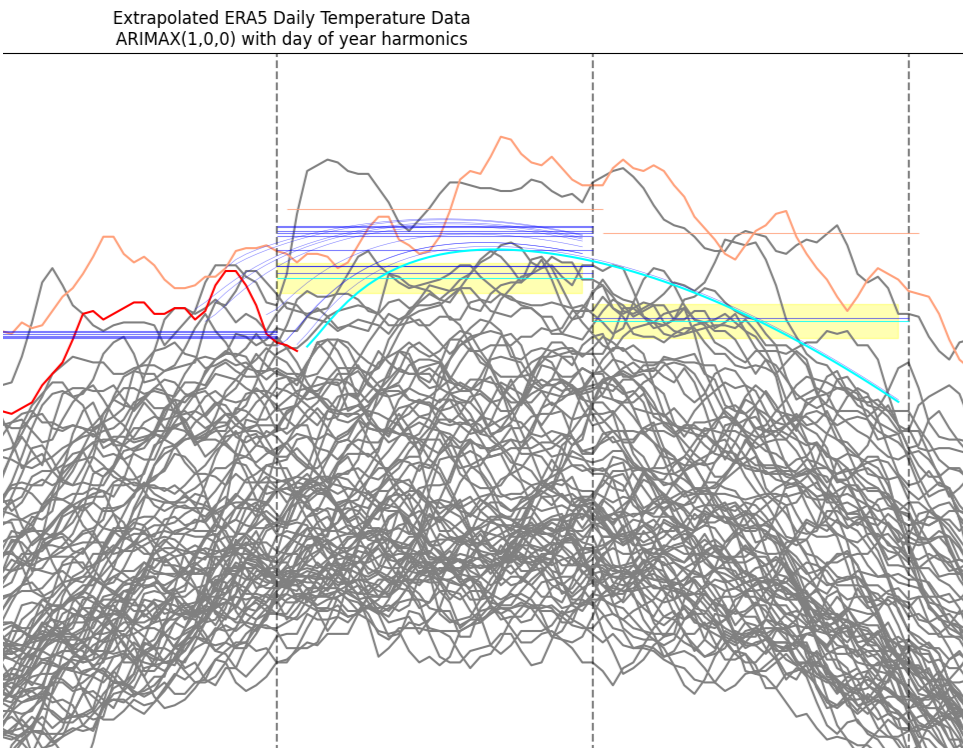
Right now my statistical model and the mid-range-only split from the models are in good agreement on the center of the distribution (~1.06 and 1.07 C), so I'm increasing the sharpness of my bet a bit.
Long range GEFS shows an increasing trend (its already 0.1-0.2 C above mid range forecasts towards end of mid range forecast); Prophet's continuation is based solely on ERA5 data (discontinuous jump).